An abstract pigment painting shaped by the sound, its dynamics and its structure.
RHYTHMENERGYSPECTRUMHARMONY
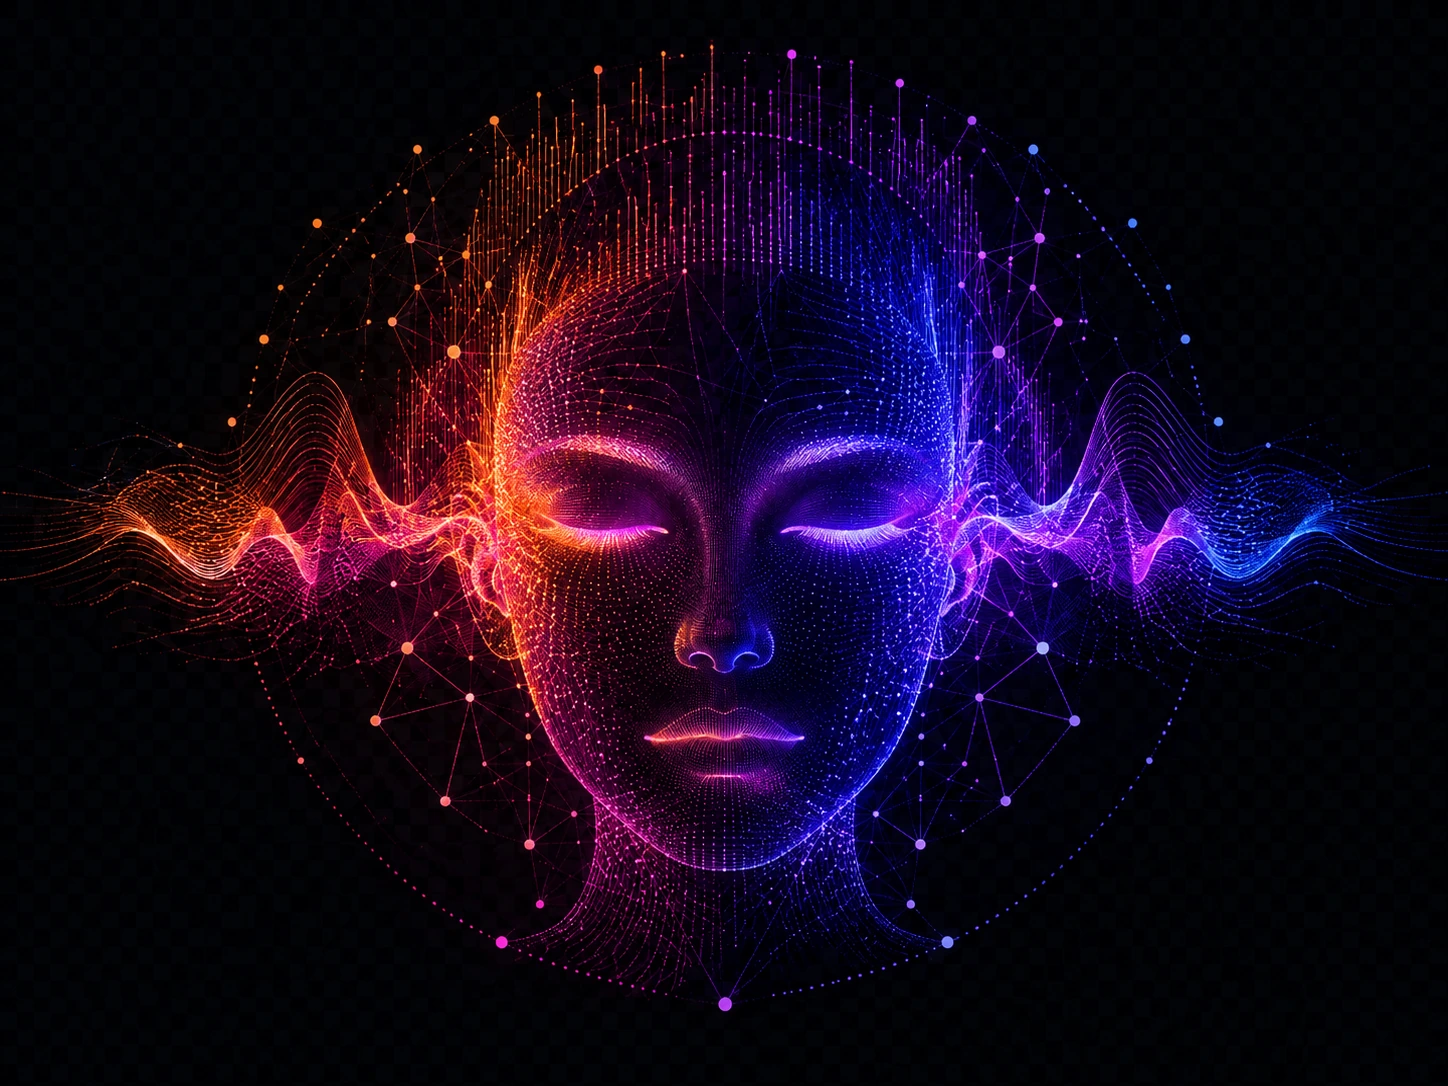
MusicDNA turns a track into a 3D sound genome, painted in real time from rhythm, energy, spectrum, and structure. A 2D mode is also available for clean share cards.
Add an audio file to /public/music and update manifest.json to start.
Each mode is driven by real, deterministic analysis.
An abstract pigment painting shaped by the sound, its dynamics and its structure.
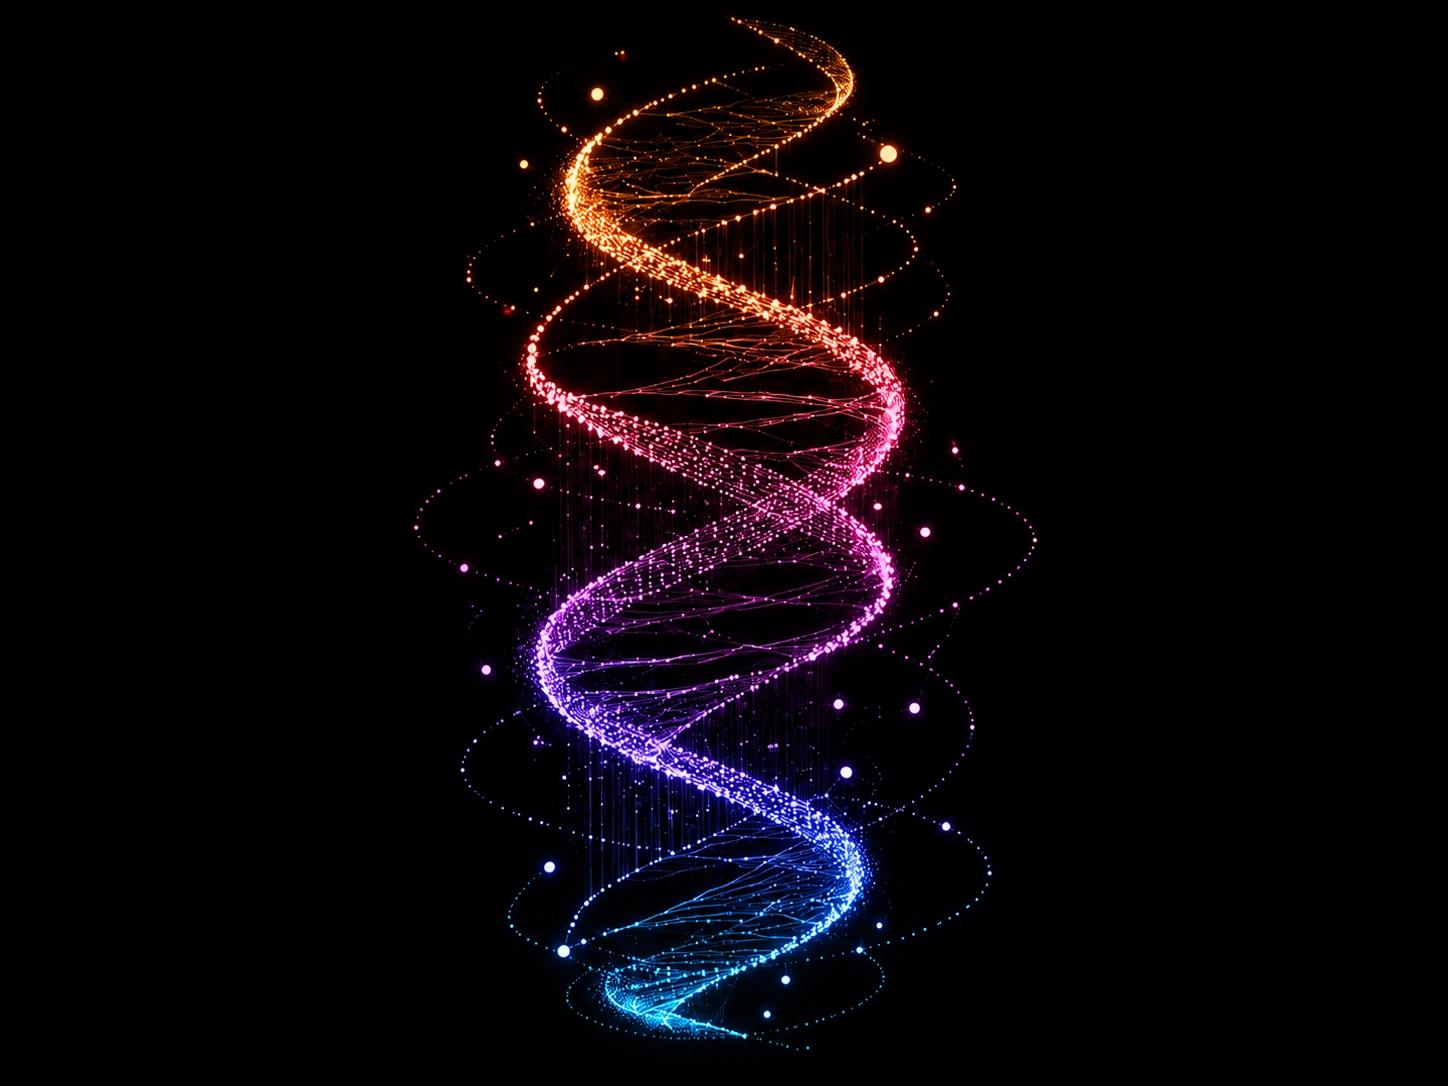
A DNA-like helix written by the song. Opens in 3D by default with rotate, zoom, auto-rotate, and camera reset. A 2D mode is available for clean share cards. Beat rungs, energy pulses, and section markers are all driven by real analysis.
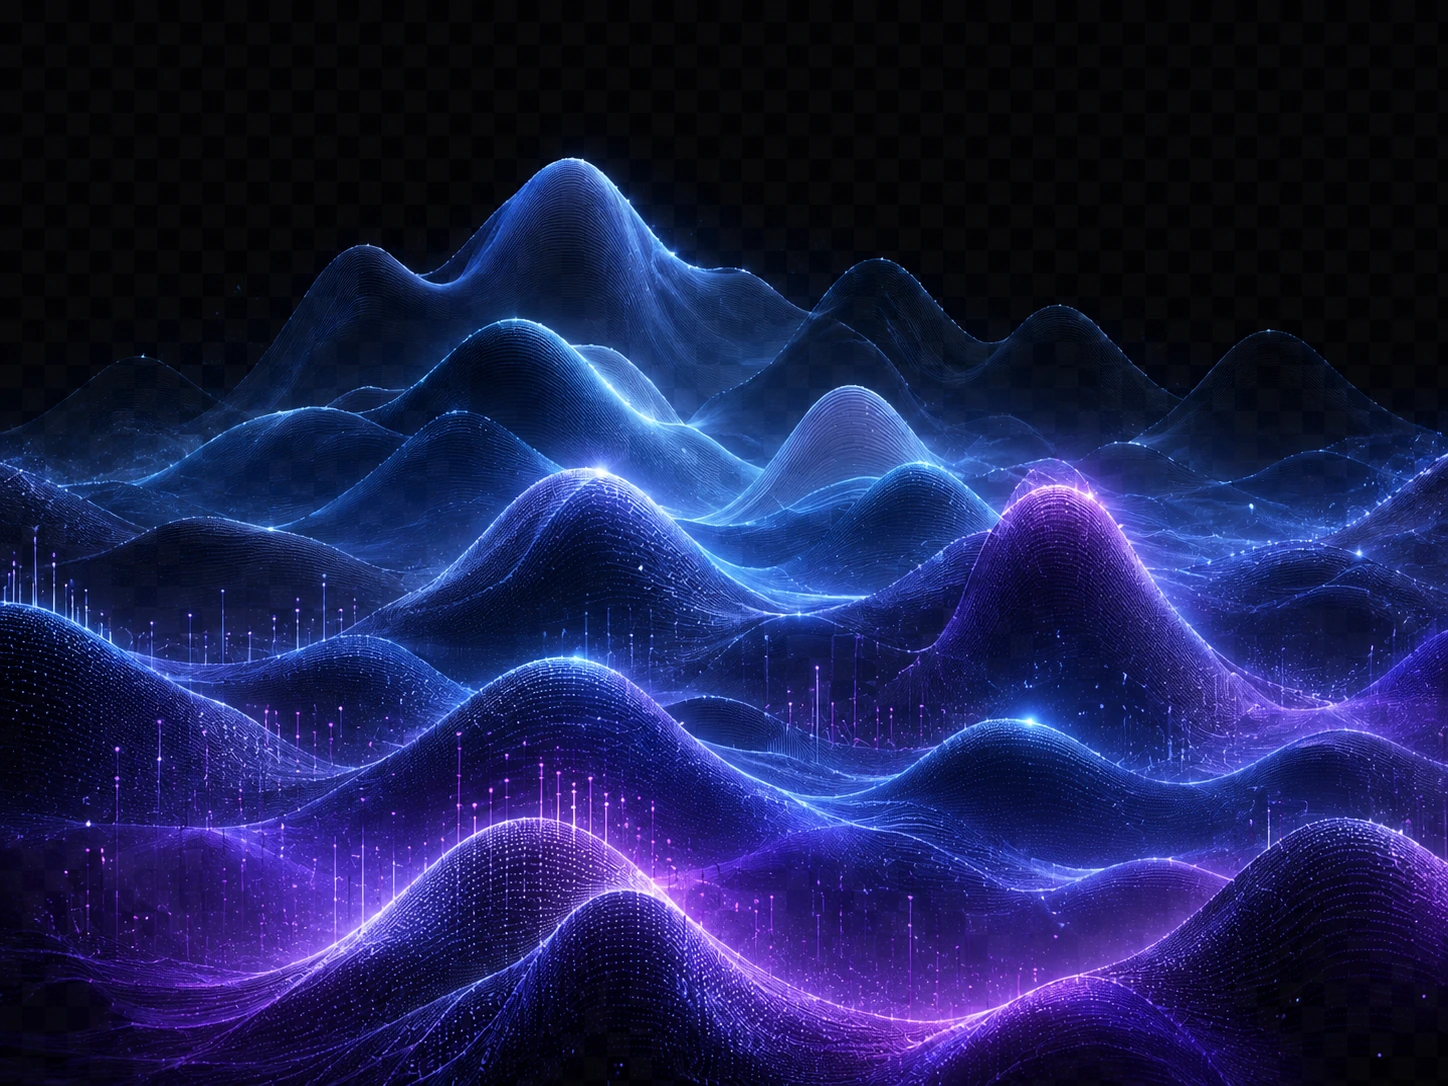
A layered audio terrain. Amplitude ridges become mountains, RMS energy forms foothills, spectral bands paint the slopes, and beats pin the horizon.
Onsets become stars on a bar-phase × time map. Downbeats anchor the sky, syncopation draws arcs, density forms clouds, sections tint the regions.
Bass, mids, and highs flow as three aurora curtains. A centroid line traces brightness, harmonic peaks glow, and highs scatter as shimmering particles.
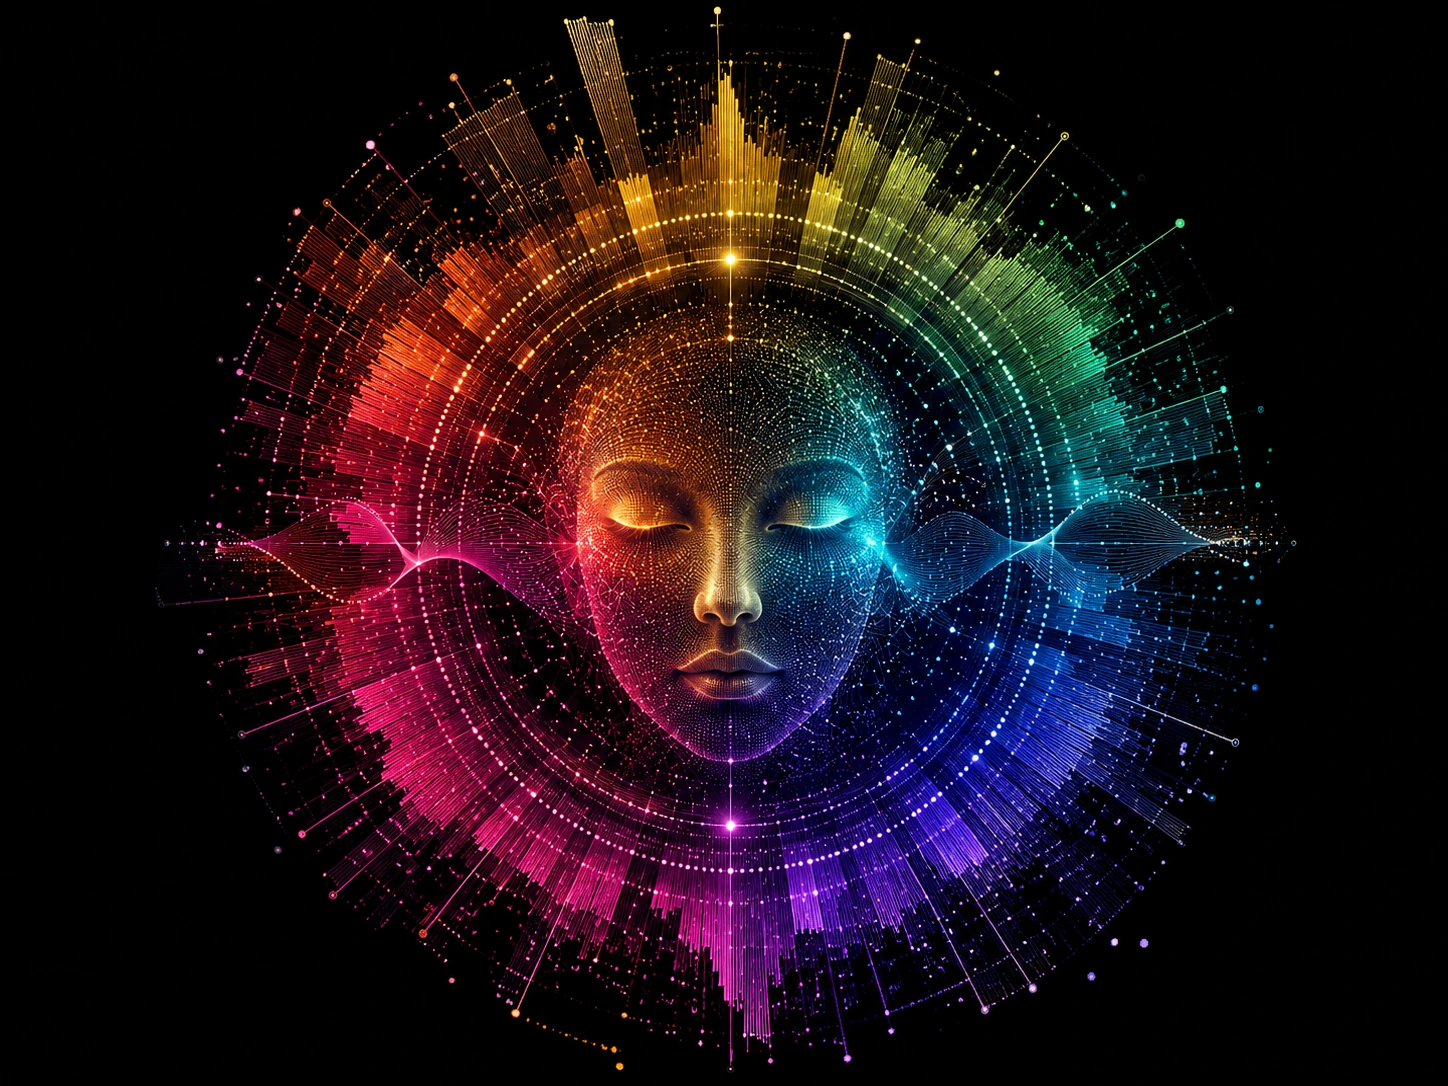
Chroma vector paints a wheel of tonal weight. Layers grow with harmonic density.
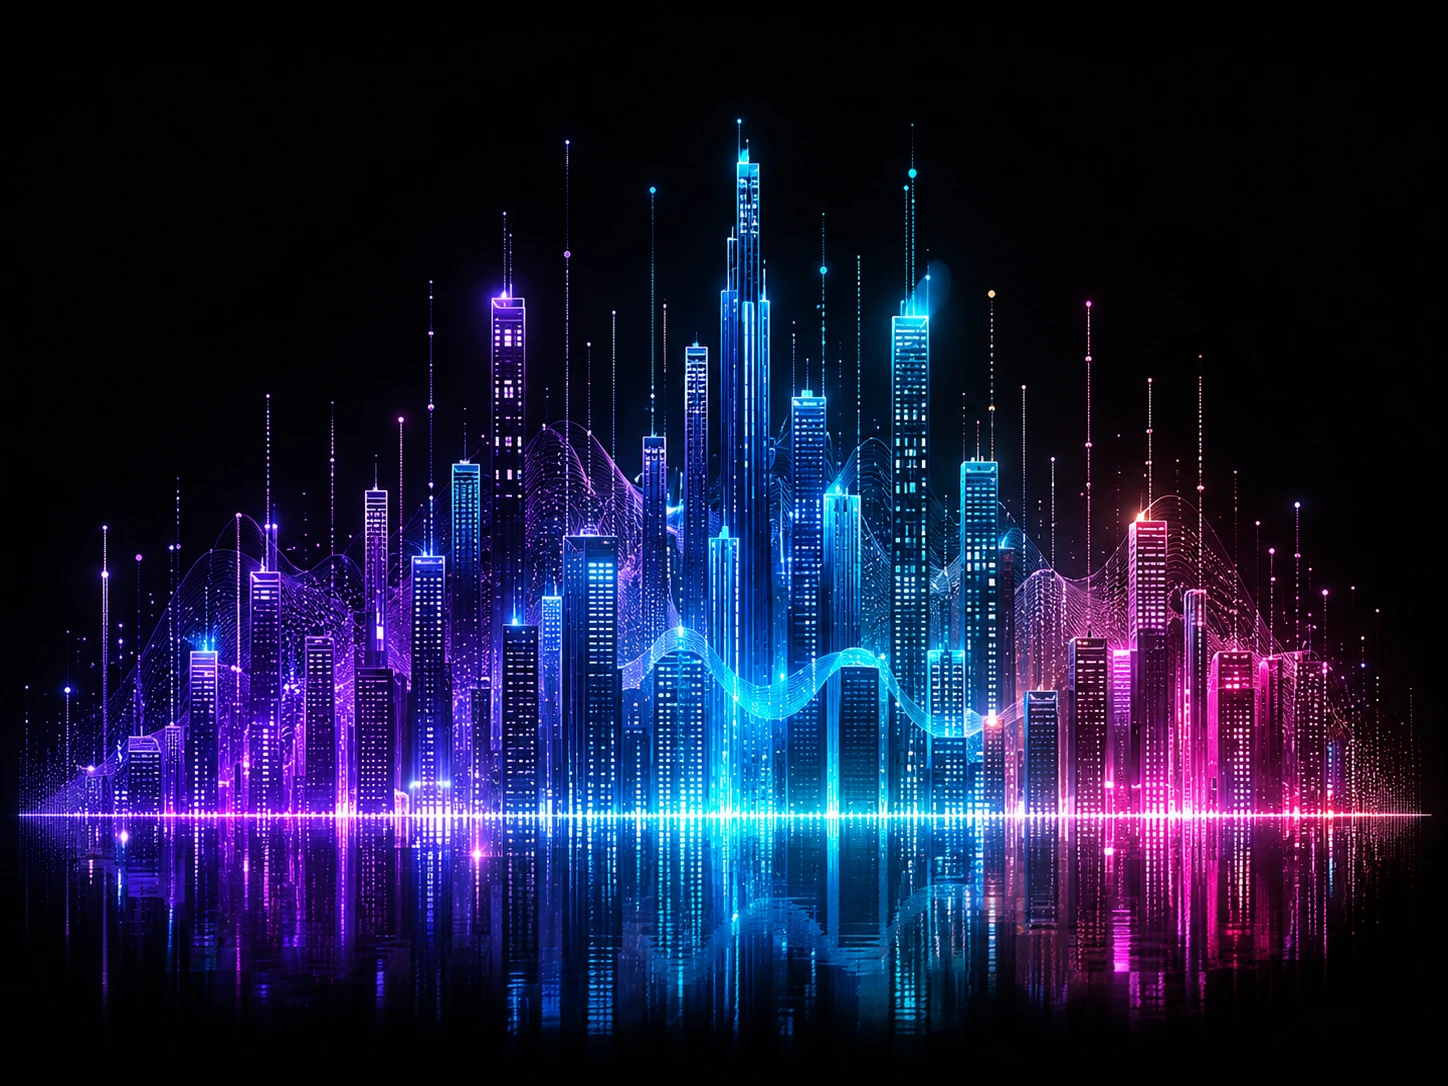
Rhythm, timbre and dynamics shape different cities: streets, squares, gardens or waterfronts.
Four steps from sound to signature.
Pick any audio file from your music folder.
We decode the file with the Web Audio API in your browser.
Rhythm, energy, spectrum, harmony, and structure are extracted from the signal.
Deterministic visualizations are rendered from the real analysis.
Visualizations are deterministic. The same file always produces the same DNA.
Analyze two tracks side by side and compare BPM, energy, brightness, dynamics, structure, mood, and key moments. MusicDNA helps you understand how two pieces of audio differ, locally in your browser, without uploading your files.
Every visual is rooted in measured signal features.
Downsampled peaks and RMS envelope across the track.
Downsampled peaks and sliding window RMS power envelope
Onset strength, beat times, and BPM estimate via autocorrelation.
Spectral flux onset detection with autocorrelation tempo tracking
FFT frames, spectral centroid, flux, and low/mid/high balance.
Short-Time Fourier Transform (STFT) with spectral centroid and flux
Chroma vector and key estimate via Krumhansl-Schmuckler profiles.
12-bin Chroma vectors matched against Krumhansl-Schmuckler profiles
Section boundaries from spectral and energy novelty.
Novelty curve self-similarity matrix for section boundaries
Loudness curve, dynamic range, loudest and quietest moments.
EBU R128 integrated loudness curve and crest factor dynamics
Not every feature is available for every track. Uncertain values are clearly labelled as estimates.
How this signal is extractedWhat music looks like changes how you listen.
Discover where a track builds tension, slows down, and reaches its peak.
Spot differences between versions, mixes, and tracks at a glance.
Generate cards, posters, and DNA images from the songs you love.
Every metric is derived from the real audio signal, not invented.
MusicDNA turns sound into a visual fingerprint, built entirely from real audio analysis on your device.
No sign-up. No tracking. No upload step.
Every metric is derived from the real signal.
Decoding and feature extraction happen on this device.
Share cards and JSON only when you choose to.
All metrics come from analysis of the selected audio file. Estimated values are labelled. If a value cannot be computed reliably, we do not show it as a fact.
Select any track from your library or experiment with our analysis algorithms in real time.